WebdriverIO JS SDK
The Evinced WebdriverIO JS SDK integrates with new or existing WebdriverIO tests to automatically detect accessibility issues. By adding a few lines of code to your WebdriverIO project, you can begin analyzing all the web pages and DOM changes to provide a dynamic view of how your site can become more accessible. As a result of the test, a rich and comprehensive report is generated to easily track issues to resolution.
Interested in seeing this in action? Contact us to get started!
Prerequisites
- WebdriverIO version 8 or higher
- Node version 16+
injectGlobalsis not set to false in the configuration (by default it is set to true)
Note: There are might be errors in the console from the Evinced SDK when using WDIO v9. These are expected and can be ignored.
Supported test runners
- Mocha
- Jasmine
- Cucumber
- Other test runners are not supported officially but can be used still
Get started
Installation
To install WebdriverIO JS SDK you will need either a file provided by Evinced Support or access to a remote repository that provides it. If you have neither, contact us to get started.
Installation with a locally provided file
With a local copy of the WebdriverIO JS SDK gzipped tar package (.tgz extension), install it in your project using NPM or Node package manager of your choice:
1# Using NPM2npm install -D <path to webdriverio-sdk-<version>.tgz file>
Installation from a remote repository
Evinced Customers have the option of accessing WebdriverIO JS SDK from a remote repository - the Evinced JFrog Artifactory - to keep their SDK version up-to-date and to share the SDK internally at their organization.
When access is enabled, WebdriverIO JS SDK is available at
https://evinced.jfrog.io/artifactory/restricted-npm/%40evinced/webdriverio-sdk.
Installation using NPM:
1npm install @evinced/webdriverio-sdk
AI Skills
The @evinced/webdriverio-sdk package ships with built-in AI agent skills that guide your AI assistant through integrating the Evinced SDK — from initial setup and writing tests to configuring rules and generating reports.
To activate AI Skills, add the following to your project's AGENTS.md file (create it at the root of your project if it does not exist):
1## Context23Before working on any accessibility testing task, always read:45`node_modules/@evinced/webdriverio-sdk/evinced-ai/entry.mdc`67The entry.mdc file contains:8- Integration rules for the Evinced WebdriverIO JS SDK9- Skills for setup, test writing, configuration, reporting, and logging10- Links to detailed documentation for each task type1112## When to use1314When the user asks about accessibility testing, WCAG compliance, ARIA attributes, Evinced SDK usage, or accessibility reports or scans, read the entry point file listed under Context.1516## Capabilities1718- Set up the Evinced SDK in WebdriverIO projects19- Write accessibility tests using `evAnalyze`, `evStart`, `evStop`20- Configure accessibility rules and scopes21- Generate HTML, JSON, SARIF, or CSV reports22- Configure the SDK — proxy, screenshots, iframes, and `evConfig.json`23- Enable and tune SDK logging and log levels24- Control SDK toggles — kill switch, analytics opt-out, and mock engine25- Integrate accessibility checks into CI/CD pipelines
Note for monorepos: with pnpm, or yarn/npm workspaces, the package may be hoisted to the workspace root. If the path above does not exist, look for evinced-ai/entry.mdc under the workspace root's node_modules instead.
This works with any AI assistant that reads project context files (Cursor, Claude, Copilot, Windsurf, Gemini, and others).
Try asking your AI assistant:
- "Set up the Evinced SDK in my project"
- "Add accessibility checks to my existing WebdriverIO test"
- "Scope the scan to only the navigation bar"
Authentication
To launch WebdriverIO JS SDK, you need to have a Service ID and an API Key.
Where to find your Evinced SDK credentials
These credentials are available via the Evinced Product Hub in the “Automation for Web” or “Automation for Mobile” product areas. Click the “Get SDK” button to see the Service Account ID and API Key at the bottom of the page.
Authenticate for Offline Testing
There are two methods to provide the token: online mode and offline mode. Online mode contacts the Evinced Licensing Server. Offline mode assumes that an Evinced employee has supplied a JSON Web Token (JWT). If an offline token is required, please reach out to your account team or support@evinced.com.
Please set credentials in environment variables and reference the environment variables in code.
1# Online mode2export EVINCED_SERVICE_ID=<serviceId>3export EVINCED_API_KEY=<apiKey>45# Offline mode, when a JWT has been provided by Evinced6export EVINCED_SERVICE_ID=<serviceId>7export EVINCED_AUTH_TOKEN=<token>
Setting credentials, an example:
1// Set online creadentials method2const serviceId = process.env.EVINCED_SERVICE_ID;3const secret = process.env.EVINCED_API_KEY;4await Evinced.setCredentials({5 serviceId,6 secret7})89// OR1011// If provided a JWT by Evinced12// Set offline credentials method13const serviceId = process.env.EVINCED_SERVICE_ID;14const token = process.env.EVINCED_AUTH_TOKEN;15Evinced.setOfflineCredentials({16 serviceId,17 token18});
Your First Test
SDK Initialization
To use WebdriverIO JS SDK, you first need to authenticate. Please refer to Authentication for details.
Importing the SDK in case of Using ECMAScript Modules
If package.json declares "type": "module" in your project, import the SDK in the wdio.conf.js as shown below:
1// wdio.conf.js2import EvincedService from '@evinced/webdriverio-sdk';3const Evinced = EvincedService.default;45exports.config = {6 // your configuration7 services: [8 [9 Evinced.WdioService,10 {11 enableScreenshots: true, // Just an example of configuration12 },13 ],14 ],15}
or in case of using TypeScript:
1// wdio.conf.ts2import EvincedService from '@evinced/webdriverio-sdk';3// @ts-ignore4const Evinced = EvincedService.default;56export const config: Options.Testrunner = {7 // your configuration8 services: [9 [10 Evinced.WdioService,11 {12 enableScreenshots: true, // Just an example of configuration13 },14 ],15 ],16}
Also in case you are using TypeScript, you may also need to update the tsconfig.json file to include the following:
1{2 "compilerOptions": {3 "allowSyntheticDefaultImports": true4 }5}
Importing the SDK in case of CommonJS projects
If package.json does not declare "type": "module" in your project, import the SDK in the wdio.conf.js as shown below.
Using Babel
In case of using Babel, you can import the SDK in the wdio.conf.js and update the .babelrc file as shown below:
1// wdio.conf.js or wdio.conf.mjs2import Evinced from '@evinced/webdriverio-sdk';34exports.config = {5 // your configuration6 services: [7 [8 Evinced.WdioService,9 {10 enableScreenshots: true, // Just an example of configuration11 },12 ],13 ],14}
1// .babelrc2{3 "presets": ["@babel/preset-env"]4}
Using TypeScript compiler
In case of using TypeScript, you can import the SDK in the wdio.conf.ts as shown below:
1// wdio.conf.ts2import EvincedService from '@evinced/webdriverio-sdk';3// @ts-ignore4const Evinced = EvincedService.default;56export const config: Options.Testrunner = {7 // your configuration8 services: [9 [10 Evinced.WdioService,11 {12 enableScreenshots: true, // Just an example of configuration13 },14 ],15 ],16}
Also in case you are using TypeScript, you may also need to update the tsconfig.json file to include the following:
1{2 "compilerOptions": {3 "allowSyntheticDefaultImports": true4 }5}
Without using a compiler
In case of not using a compiler, you can import the SDK in the wdio.conf.js as shown below:
1const Evinced = require('@evinced/webdriverio-sdk').default;23exports.config = {4 // your configuration5 services: [6 [7 Evinced.WdioService,8 {9 enableScreenshots: true, // Just an example of configuration10 },11 ],12 ],13}
Then you must authenticate: you may want to run the authentication method in a before hook from your wdio.config file in the following way:
1// wdio.conf.ts or wdio.conf.js or wdio.conf.mjs2before: async function(capabilities, specs) {3 // Set offline credentials method4 Evinced.setOfflineCredentials({5 serviceId: '<serviceID>',6 token: '<token>'7 });89 // Set online creadentials method (through Evinced licence server)10 await Evinced.setCredentials({11 serviceId: '<serviceID>',12 secret: '<apiKey>'13 });14}
After that the SDK is ready to be used in your tests.
Add Evinced Accessibility Checks (Single Run Mode)
This is a simple example of how to add an Evinced accessibility scan to a test. Please note the inline comments that give detail on each test step.
1test("evAnalyze", async () => {2 await browser.url("https://example.com/");3 // Scan the page for accessibility issues4 const issues = await browser.evAnalyze();5 expect(issues).toHaveLength(0);6});
Add Evinced Accessibility Checks (Continuous Mode)
This is an example of how to add a continuous Evinced accessibility scan to a test. Using the
evStart() and evStop() methods, the Evinced engine will continually scan in the background capturing all DOM changes and page navigation as the test is executed. This will capture all accessibility issues as clicking on drop-downs or similar interactions reveals more of the page. The advantage of continuous mode is that no interaction with the actual test code is needed.
1test("evStart/evStop", async () => {2 await browser.url("https://example.com/");3 await browser.evStart();4 await $("#button-1").click();5 await $("#button-2").click();6 const issues = await browser.evStop();7 expect(issues).toHaveLength(0);8});
API
Evinced.Wdioservice
Prepares the Evinced object for use in the project.
1services: [2 [3 Evinced.WdioService,4 {5 axeConfig: {6 rules: {7 'link-name': { enabled: false }8 }9 },10 logging: {11 LOGGING_LEVEL: 'error',12 ADD_LOGGING_CONTEXT: true13 },14 skip_validations: [],15 toggles: {},16 },17 ]18]
Refer to Configuration to see examples of initializing with options.
evAnalyze(options)
Scans the current page and returns a list of accessibility issues. This is the recommended method for static page analysis.
Note: This method is not supported if evStart() is already running.
1const issues = await browser.evAnalyze({2 axeConfig: {3 rules: {4 "link-name": { enabled: false },5 },6 },7});
Returns Promise<Issue[]>.
The returned report object contains a list of accessibility issues.
For more information regarding reports as well as the report object itself, please refer to our detailed Web Reports page.
evStart(options)
Continually watches for DOM mutations and page navigation, recording accessibility issues
until the evStop() method is called. This method is recommended for dynamic page flows.
1await browser.evStart({2 axeConfig: {3 rules: {4 "link-name": { enabled: false },5 },6 },7});8await $("#button-1").click();9await $("#button-2").click();10const issues = await browser.evStop();
Returns Promise<void>.
evStop(options)
Stops the issue-gathering process started by evStart().
1await browser.evStart();2await $("#button-1").click();3await $("#button-2").click();4const issues = await browser.evStop();
Returns Promise<Issue[]>.
The returned report object includes all accessibility issues detected between
the evStart() and evStop() method calls.
For more information regarding reports as well as the report object itself, please refer to our detailed Web Reports page.
Page Flows API
Page Flows take accessibility testing further by putting the page through real interaction — tabbing through the page, resizing the viewport — the way a real user actually would, then checking what that interaction reveals. It's an empirical layer of coverage on top of evAnalyze()'s static analysis, surfacing more issues.
Run them standalone with the methods below, or fold their findings straight into evAnalyze() by turning on scan.pageFlows.enabled — see Page Flows under Configuration.
analyzeFocusIndication(options?)
Tabs through every focusable element on the page and reports keyboard-focus visibility problems: a missing or low-contrast focus indicator.
1const issues = await browser.pageFlows.analyzeFocusIndication();
Override the timeout for a single call:
1const issues = await browser.pageFlows.analyzeFocusIndication({2 scan: { pageFlows: { timeout: 90000 } }3});
Accepts the same configuration overlay as evAnalyze() (for example scan.pageFlows.timeout, shown above) either project-wide or for this call only.
Returns Promise<Issue[]> — the same issue shape every other method returns, so the result merges, filters and saves through the machinery you already use.
Note: Chromium only. On a browser without Chrome DevTools the call returns no issues. This moves the page's real keyboard focus and is comparatively slow. Run it standalone rather than inside a continuous evStart()/evStop() session.
analyze2DScroll(options?)
Shrinks the page to a 320x256 CSS viewport — the standard's "400% zoom" equivalent — and reports content that then needs scrolling in both directions at once to reach: self-contained, nested-horizontal and nested-vertical scrolling. Maps WCAG 1.4.10 (Reflow). Elements with role="table", role="grid", or <video> are exempt, per the criterion's own two-dimensional-layout carve-out.
1const issues = await browser.pageFlows.analyze2DScroll();
Override the timeout for a single call:
1const issues = await browser.pageFlows.analyze2DScroll({2 scan: { pageFlows: { timeout: 90000 } }3});
Accepts the same configuration overlay as evAnalyze() (for example scan.pageFlows.timeout, shown above) either project-wide or for this call only.
Returns Promise<Issue[]> — the same issue shape every other method returns, so the result merges, filters and saves through the machinery you already use.
Note: Chromium only. On a browser without Chrome DevTools the call returns no issues. This resizes the browser viewport for the duration of the call and is comparatively slow. Run it standalone rather than inside a continuous evStart()/evStop() session.
evSaveFile(issues, format, destination)
Saves issues in a file with the specified format and location.
Supported formats are json, html, sarif, and csv.
Find detailed information in the Web Reports page.
1await browser.url("https://demo.evinced.com/");23const issues = await browser.evAnalyze();45const filePath = path.resolve(__dirname, "evinced-report.html");6await browser.evSaveFile(issues, "html", filePath);
Returns Promise<void>.
Aggregated Report
The aggregated report feature allows you to have a general aggregated report for
the whole run (not only for one test or suite). This report will contain all the
issues found by the tests where evStart() and
evStop() commands were called. It is still possible to use the
evSaveFile() command in any place of your code along with this
Aggregated Report feature.
For using the aggregated report feature you should update your config file wdio.conf.js.
1services: [2 {3 reporterOptions: {4 generateAggregatedReport: true, // Enables the aggregated report feature. Mandatory.5 deleteTmpFiles: true, // Deletes tmp files after the final report is generated. Optional. Default: true.6 reportFormat: 'html', // Sets a desired format for the report. Available options are: html, sarif, and json. Optional. Default: html.7 fileName: 'aggregatedReport.html', // Specifies a name of the final report. Optional. Default: aggregatedReport.html.8 outputDir: './evincedReports', // Specifies a path to the final aggregated report file. Optional. Default: ./evincedReports.9 tmpDir: './evincedReports/tmp' // A directory for storing Evinced tmp files. Optional. Default: ./evincedReports/tmp.10 }11 }12]
Configuration
The same configuration options can be used when initializing the Evinced object
using Evinced.Wdioservice and when calling the evStart()
and evAnalyze() methods but with a bit different consequences.
Providing options when initializing defines a global configuration for all calls
of evAnalyze() and evStart(), while providing options to
either of those methods affect only the test in which they are called. Some SDKs
also let you define configuration outside your code, in a config file that is
picked up automatically at startup.
Options provided in either evAnalyze() or evStart() override
those set in Evinced engine initialization.
Engines Configuration
Evinced uses two separate engines when scanning for accessibility issues, one is the aXe engine and the other is the Evinced engine. By default, Evinced disables the aXe Needs Review and Best Practices issues based on customer request and due to the fact they are mostly false positives. Please note this setting when comparing issue counts directly. See an example of how to enable Needs Review and Best practices issues in the Toggles section.
Configuration Object
1export type TInitOptions = {2 enableScreenshots?: false,3 rootSelector?: string,4 enableShadowDom?: false,5 filterIssues?: IssuesFilter,6 axeConfig?: axe.RunOptions,7 logging?: {8 LOGGING_LEVEL?: 'error'|'debug'|'warn'|'info',9 ADD_LOGGING_CONTEXT?: boolean10 }11 skip_validations?: {12 selector: string,13 urlRegex: string,14 validationTypes: string[]15 }[],16};
Root Selector
Sets a CSS selector to limit the Evinced Engine to scan only the selected element and its children. Must be a valid CSS selector. If not set, the Evinced Engine will scan the entire document.
Default: no value
1const issues = await browser.evAnalyze({2 rootSelector: "#some .selector"3});
User-Defined Labels
Attaches your own metadata to every issue element, so a report can be grouped by your
structure — team, feature area, component — instead of by DOM position. Labels appear on each
issue under elements[].userLabels, grouped by the kind of rule that produced them:
1"userLabels": {2 "matchingSelectors": ["#cart |+ .buy-button"],3 "attributes": {4 "data-testid": ["checkout-submit"]5 },6 "callback": {7 "team": ["checkout"],8 "stableId": ["WRONG_SEMANTIC_ROLE:BuyButton"]9 }10}
Three rule types are available, and they can be combined:
selector— label an element by a CSS selector it matches or descends from.attribute— label an element with the value of an attribute on it or its nearest ancestor.function— this is the option to reach for when you need a stable identity for an issue that survives DOM changes — for example a component name read from adata-attribute, or an id built from an element's position in your own component tree rather than in the document.
Default: no labels.
Unlike most options on this page, userDefinedLabels is only read under scan — there is no
flat top-level form of it, and one passed at the top level is ignored without an error.
All three rule types. Set them once in wdio.conf.js so every scan gets them, or per command.
1// wdio.conf.js — applies to every scan.2services: [3 [4 Evinced.WdioService,5 {6 scan: {7 userDefinedLabels: [8 // Label anything inside #cart by the matched ancestor.9 { type: 'selector', selector: '#cart |+ .buy-button' },10 // Label with the value of the nearest data-testid attribute.11 { type: 'attribute', attribute: 'data-testid', scope: 'closest' },12 // Compute labels yourself, per issue element.13 {14 type: 'function',15 fn: (element, typeId) => ({16 team: [element.closest('[data-team]')?.getAttribute('data-team') ?? 'unowned'],17 stableId: [`${typeId}:${element.getAttribute('data-component') ?? 'unknown'}`]18 })19 }20 ]21 }22 },23 ],24],
Or for one command only:
1const issues = await browser.evAnalyze({2 scan: {3 userDefinedLabels: [{ type: 'attribute', attribute: 'data-testid', scope: 'closest' }]4 }5});
For a longer callback, keep it in its own .js file whose contents evaluate to a function.
1const issues = await browser.evAnalyze({2 scan: { userDefinedLabels: [{ type: 'function', scriptPath: './labels/teamLabels.js' }] }3});
1// ./labels/teamLabels.js2function (element, typeId) {3 return { team: [element.closest('[data-team]')?.getAttribute('data-team') ?? 'unowned'] };4}
A relative scriptPath is resolved from the working directory of the process running the tests —
where the runner was launched, normally the project root, and never the spec file's own directory.
Use path.resolve(__dirname, 'labels/teamLabels.js') for a path relative to the spec.
If the function is placed there by the application or by your own script, pass only its ref.
It must start with __evUserLabelsFn_, so a typo cannot resolve an unrelated global such as
print.
1const issues = await browser.evAnalyze({2 scan: { userDefinedLabels: [{ type: 'function', ref: '__evUserLabelsFn_team' }] }3});
Choosing a form. The forms above differ in one way that matters: in all of them except the
last, you hand the SDK the callback itself and the SDK owns installing it — into the top document
and into every frame it scans, re-installing into frames that navigate or appear later, so nothing
further is required of you. Supply only a ref when the application itself puts the function on
the page; covering every frame is then your job, as described below. Where your SDK offers more
than one way to hand over the callback, keep a short one where it is used and move a longer one
into its own file. Except in Cypress the callback reaches the page as source, so it cannot use
helpers, imports, or variables from the file it is written in — define what it needs inside it.
Rules for the callback
A function rule runs your callback in the page under test, once per issue element:
1callback(element, typeId) -> Record<string, string[]>
element is the DOM element the issue was reported on, and typeId is the issue type
(the same value as type.id in a JSON report). Whatever the callback returns is merged into
that element's userLabels.callback.
Important: The callback itself is never part of the configuration the engine receives. Configuration is plain data — it has to be copied into the page, and then copied again into every frame the engine scans — so it can only carry a name, not a live function.
The function itself must exist on the global object (window) of each page or frame the engine
scans, under that name. The engine looks up the name and calls whatever it finds there. This name
is the rule's ref — you can choose it yourself, or let the SDK generate one.
Before using this feature, decide whether the function will already be on the page yourself, or whether the SDK should install it for you — see Who installs the callback below.
- It must be synchronous. The engine uses the return value immediately, so a promise is
never awaited. An
asyncfunction is rejected before it is installed — the rule is skipped and the SDK logs why — because that case can be spotted up front. A plain function that happens to return a promise can only be caught once it runs, so it is reported per element (see below). - Each callback needs its own
ref. Twofunctionrules resolving to the samerefare rejected, and the second is dropped with a warning. This is not a harmless duplicate: both rules would resolve to the same function on the page and produce identical labels, which is almost always a copy-paste slip rather than an intent. - It must return
Record<string, string[]>— an object whose values are arrays of strings. Any other shape is reported as an error. - It must not throw, though nothing breaks if it does — see below.
- In every SDK except Cypress it must be self-contained. These SDKs drive the browser from outside it, so the callback is serialised to source and injected into the page: helpers, imports, and variables from the surrounding file are not in scope when it runs. Inline everything it needs. Cypress runs inside the browser, so its callback may use values from the spec.
- Label keys and values are capped (20 keys and 50 values per key per callback; 200 characters each). Anything over the cap is dropped rather than truncated, because these are identity strings and a truncated id would silently collide with another.
Example
A callback that gives each issue an owner and an id tied to your component tree rather than to the element's position in the document:
1function (element, typeId) {2 // Helpers live inside the callback on purpose: outside Cypress it reaches the page as3 // source, so nothing from the file it was written in is in scope when it runs.4 function slug(value) {5 return String(value == null ? '' : value)6 .toLowerCase()7 .replace(/[^a-z0-9]+/g, '-')8 .replace(/^-+|-+$/g, '')9 .slice(0, 40);10 }1112 var card = element.closest('[data-component]');13 if (!card) {14 // Return an empty object, not nothing: `undefined` is not a `Record<string, string[]>`,15 // so falling off the end here would put a `__callbackError` on every element that16 // misses the lookup.17 return {};18 }1920 var labels = {};21 var team = card.getAttribute('data-team');22 if (team) {23 labels.team = [team];24 }25 // Pair the type with the component so two different issues on one component stay apart.26 labels.stableId = [typeId + ':' + slug(card.getAttribute('data-component'))];27 return labels;28}
Given <div data-component="Buy Button" data-team="checkout"> around the reported element,
that returns:
1{2 "team": ["checkout"],3 "stableId": ["WRONG_SEMANTIC_ROLE:buy-button"]4}
which arrives in the report under the callback bucket of that element:
1"userLabels": {2 "callback": {3 "team": ["checkout"],4 "stableId": ["WRONG_SEMANTIC_ROLE:buy-button"]5 }6}
The keys are yours — team and stableId here — and every value is an array of strings, even
when there is only one. Re-run the scan after the DOM around the button changes and stableId
stays the same, which is the point: it is derived from your component, not from the element's
position.
Who installs the callback
This is the decision from above, spelled out. The two arrangements differ in one important way — who's responsible for getting the function into every frame the engine scans, not just the top page.
The SDK installs it — you supply the function (or a .js file, or JavaScript source). The SDK
puts it on the page for you, in the top document and in every frame it scans, re-installing into
frames that navigate or appear later. Nothing further is required of you.
You install it — you assign the function to a global of your own on the page and pass only
that name as the rule's ref. The SDK then installs nothing, and the engine looks the ref up
separately in every frame it scans. So with iframe scanning enabled, you have to assign your
function in each frame's own global scope as well; a frame where the ref is not defined reports
__callbackError for every issue found there.
Either way the ref must start with __evUserLabelsFn_. The engine refuses any other name,
because the global object is full of callable things that are not label callbacks: a ref of
print or alert would otherwise resolve, pass the engine's is-it-a-function check, and be
invoked once per issue element. Names beginning __evUserLabelsFn_auto_ are reserved for the ones
the SDK generates, so a name you choose can never collide with one of those.
When a callback misbehaves
A broken callback never fails the scan. The problem is reported in the report itself, under
a reserved __callbackError label key beside the real labels, so it can be found without reading
SDK logs:
1"userLabels": {2 "callback": {3 "__callbackError": [4 "callback '__evUserLabelsFn_0' threw: el.closest is not a function"5 ]6 }7}
The same label key covers a callback that is missing, throws, returns the wrong shape, returns a
promise, or exceeds the label limits. To audit a run, search a JSON report for
__callbackError.
Axe Configuration
Configures Axe open-source accessibility toolkit, which the Evinced engine includes with its own, more extensive accessibility detection. For full Axe config options, see Axe Core API.
1await browser.evStart({2 axeConfig: {3 rules: {4 "link-name": { enabled: false },5 },6 },7});8const issues = await browser.evStop();
Engine Logging
Set level of messages the Evinced engine will print to the console.
Valid levels are "debug", "info", "warn" and "error".
Default: "error"
1const issues = await browser.evAnalyze({2 logging: {3 LOGGING_LEVEL: 'debug',4 ADD_LOGGING_CONTEXT: true5 }6});
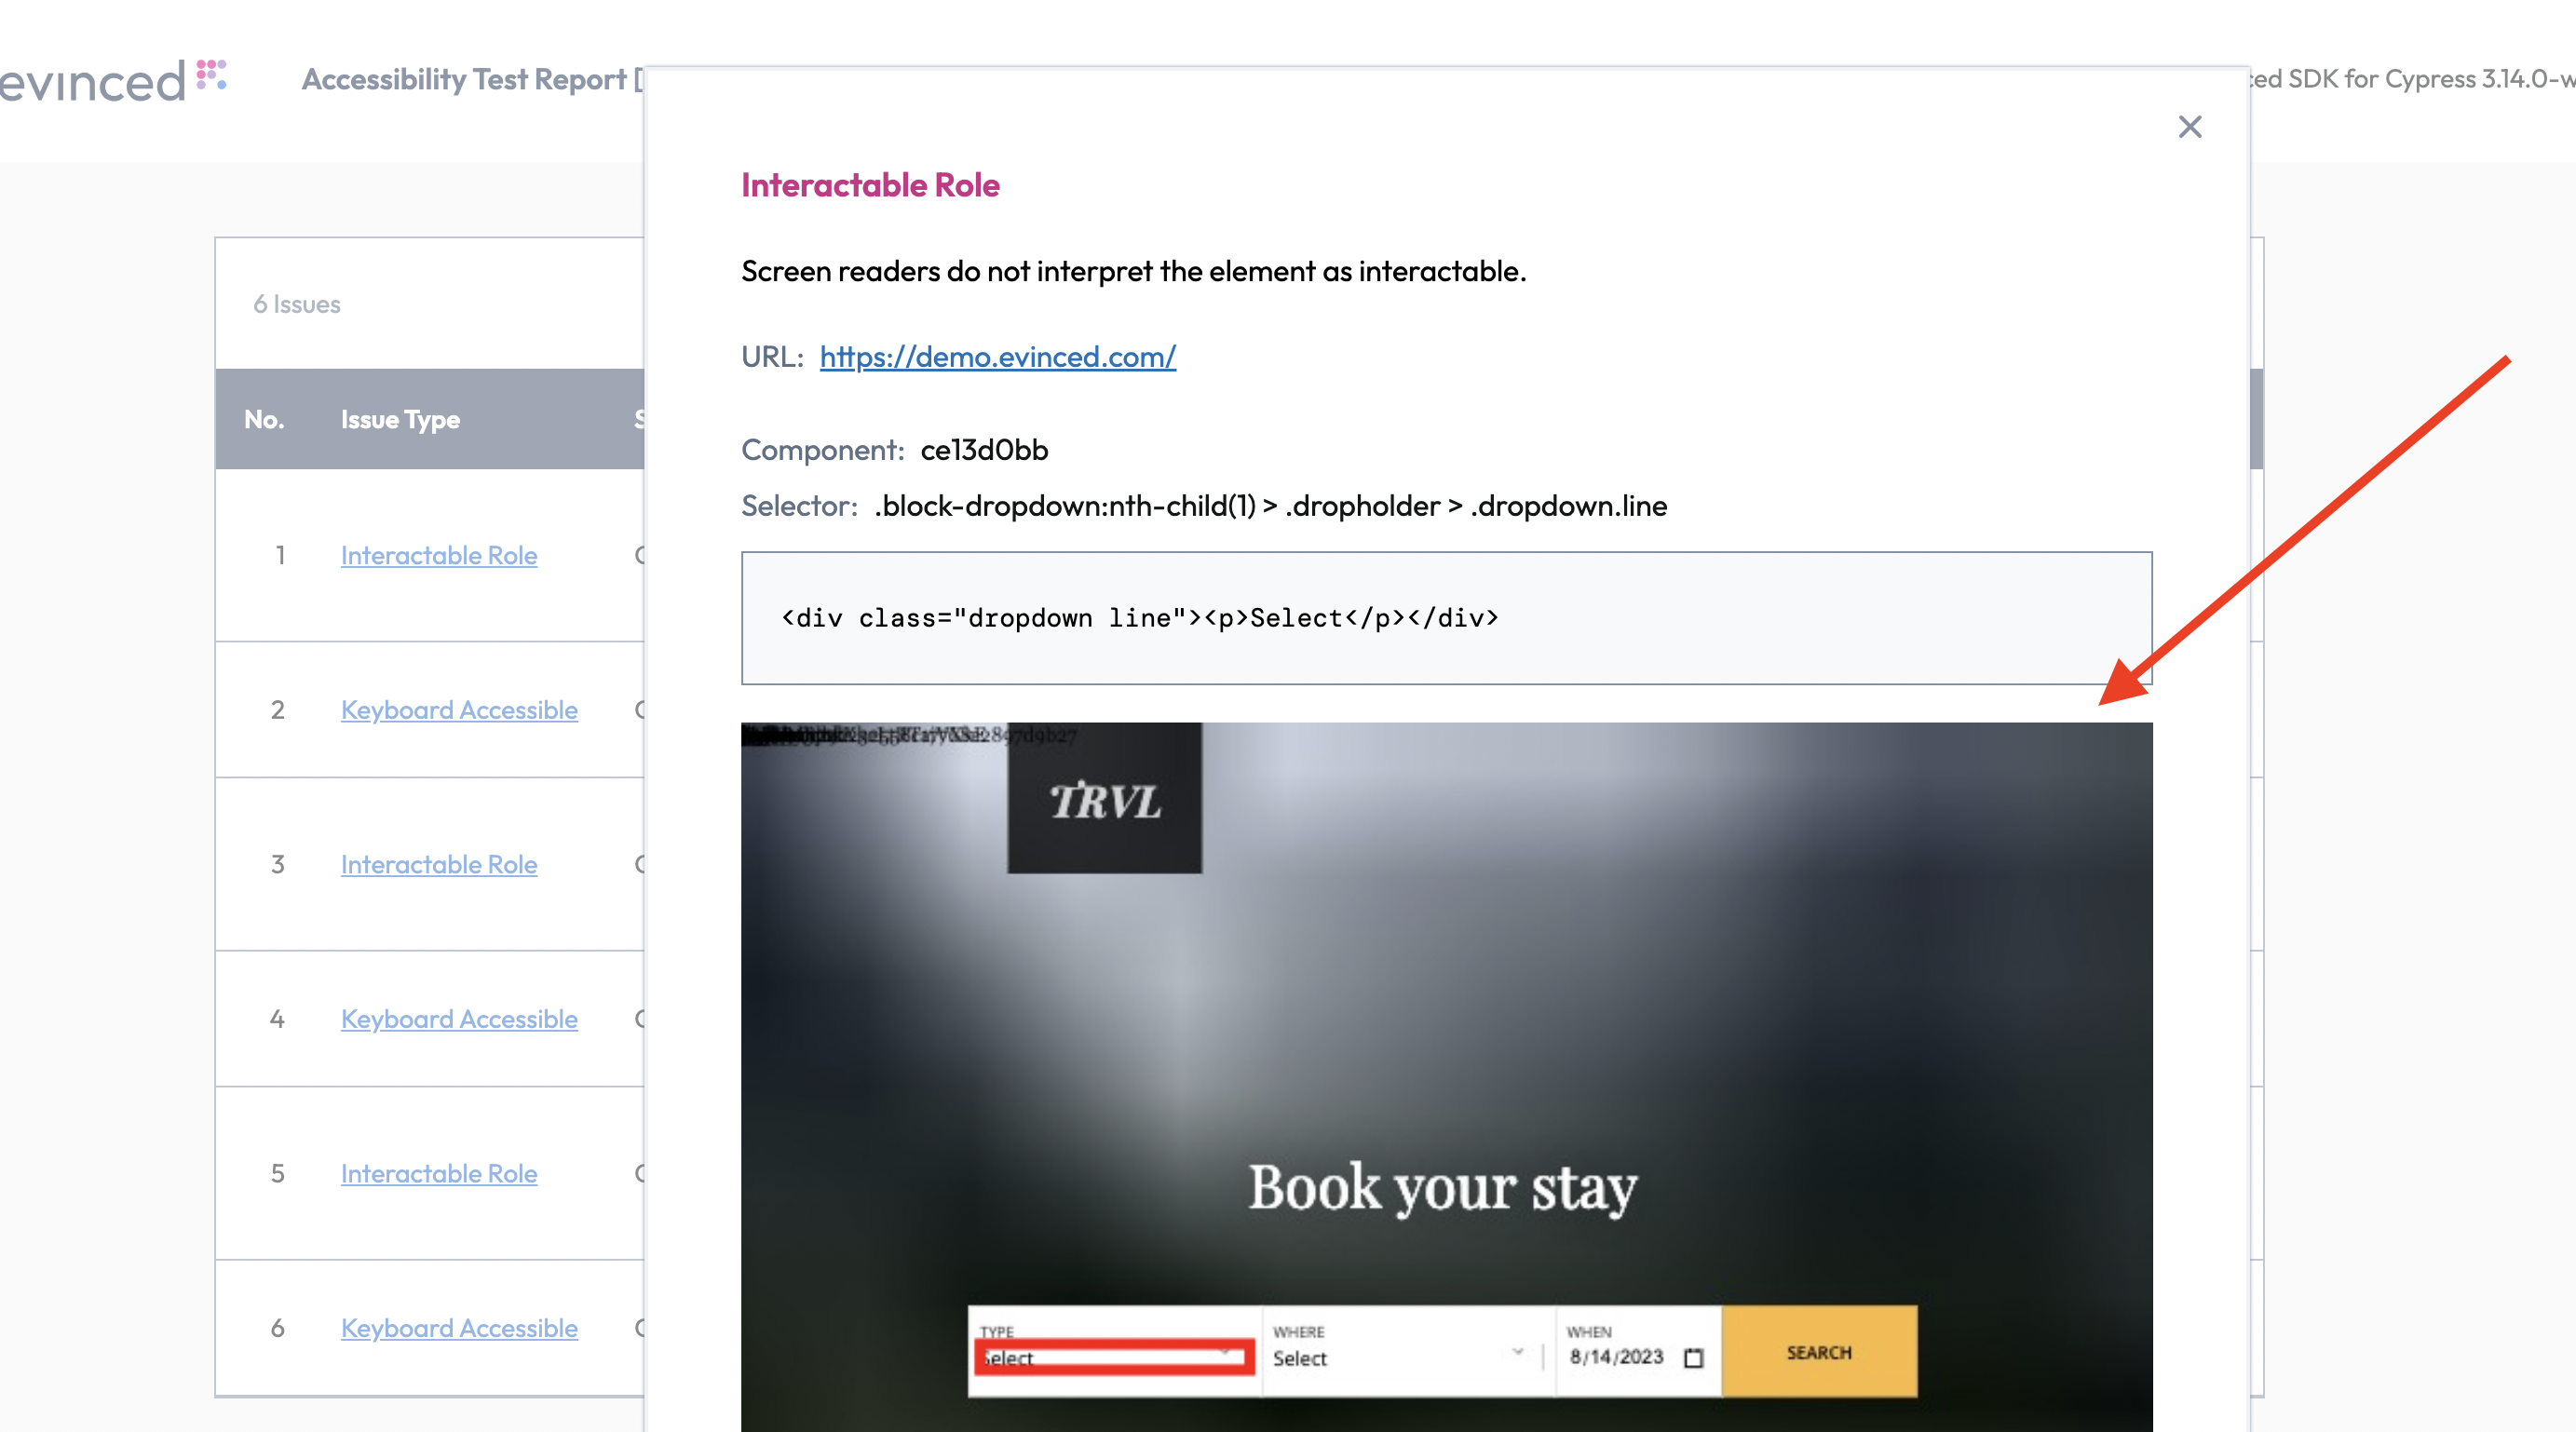
Reports Screenshots
When true, the Evinced SDK will include screenshots in its reports that
highlight elements with accessibility issues.
Default: false.
Note: Enabling screenshots may affect test run performance.
1exports.config = {2 services: [3 [Evinced.WdioService, {4 enableScreenshots: true5 }]6 ]7};
How screenshots are captured
When screenshots are enabled, the SDK captures them itself over the Chrome DevTools Protocol, reached through the Puppeteer connection (browser.getPuppeteer()) that the SDK already uses for interaction support. WebDriver's own screenshot command captures only the viewport, so CDP is what makes a full-page capture possible.
If the Puppeteer connection is unavailable — for example on a Selenium Grid or Kubernetes deployment that does not expose the DevTools endpoint, or when usePuppeteer: false is set — the SDK falls back automatically and the analysis engine captures the screenshots in the page instead. A warning naming the reason is written to the SDK log; the scan itself is unaffected. If captures start failing once the bridge is running — two consecutive timeouts, or a single protocol error — the engine's capture takes over from the next analysis onwards.
Captures are full-page and rendered at one image pixel per CSS pixel, so the issue highlights in an HTML report line up with the image. This is not configurable.
Known limitations
An issue on an element inside an <iframe> is highlighted at the wrong position in the HTML report: the element's coordinates are relative to the iframe document rather than to the top-level page. The screenshot itself is correct and the issue is reported normally — only the highlight is misplaced.
Switching back to engine-side capture
scan.screenshots.mode chooses which side captures. It is read only when scan.screenshots.enabled is true.
| Value | Effect |
|---|---|
| unset | The SDK captures the screenshots. This is the default. |
'sdk' | Identical to leaving it unset. Accepted so that configurations written before SDK-side capture became the default keep working — it no longer switches anything on. |
'browser' | The analysis engine captures the screenshots in the page, as it did before SDK-side capture. The image is redrawn inside the page rather than taken by the browser's own compositor, so it can differ from what you see on screen. |
'off' | Skips screenshots for this call even when enabled: true is set globally. Useful for a single spec; to turn screenshots off everywhere, prefer enabled: false. |
Reach for 'browser' only where SDK-side capture does not suit your environment; leave mode unset otherwise.
Per command:
1const issues = await browser.evAnalyze({2 scan: { screenshots: { enabled: true, mode: 'browser' } }3});
Or in wdio.conf.js, alongside the rest of your service configuration:
1exports.config = {2 services: [[Evinced.WdioService, {3 scan: { screenshots: { enabled: true, mode: 'browser' } }4 }]]5};
Page Flows
When true, evAnalyze() also runs the checks behind browser.pageFlows.analyzeFocusIndication() and browser.pageFlows.analyze2DScroll(), merging their issues into the same returned array and into the saved and aggregated reports. Settable project-wide or for a single call.
Default: false.
Note: Enabling this can noticeably slow down evAnalyze(), since these checks tab through every focusable element and resize the viewport. This setting is ignored during a continuous evStart()/evStop() session — the SDK logs a warning rather than running the checks there. Run browser.pageFlows.analyzeFocusIndication() / .analyze2DScroll() directly, or a one-off evAnalyze() call, instead.
For every analysis in the run, add the setting to the service options in wdio.conf.js:
1services: [2 [3 Evinced.WdioService,4 {5 scan: { pageFlows: { enabled: true } }6 },7 ],8],
It can also be set for a single call:
1const issues = await browser.evAnalyze({2 scan: { pageFlows: { enabled: true } }3});
Toggles
Enables experimental features. Feature names and values may vary from release to release.
Example:
1exports.config = {2 services: [3 [Evinced.WdioService, {4 experimentalFlags: {5 USE_AXE_NEEDS_REVIEW: true,6 USE_AXE_BEST_PRACTICES: true7 }8 }]9 ]10};
Skip Validations
Sets validation types to be skipped for specified URL pattern and CSS selector. Issue type IDs can be found by inspecting a JSON report as described in Web Reports.
Default: no validations skipped.
1const skippedValidation1 = {2 "selector": 'selector1',3 "urlRegex": "www\\.mysite\\.org",4 "validationTypes": [5 "WRONG_SEMANTIC_ROLE",6 "NO_DESCRIPTIVE_TEXT",7 ]8}9const issues = await browser.evAnalyze({ skip_validations: [skippedValidation1] });
Skipping every validation type
To suppress all validation types for a selector, pass the wildcard * in place of a list of
type names.
The wildcard must be the only value. Listed alongside concrete type names it is not treated as a wildcard — the wildcard entry is ignored and only the concrete types given with it are skipped.
1const skipEverythingInParent = {2 "selector": '#parent, #parent *',3 "urlRegex": "www\\.mysite\\.org",4 "validationTypes": "*"5}6const issues = await browser.evAnalyze({ skip_validations: [skipEverythingInParent] });
A selector matches elements, not subtrees
Skip rules are evaluated against each reported element on its own, so a selector suppresses issues only on the elements it matches — not on anything nested inside them. To cover a container and its contents, list both the container and its descendants:
1#parent, #parent *
#parent alone suppresses only issues reported on #parent itself.
Include Validations
Reports only the validation types listed, and drops everything else. This is the allowlist counterpart of Skip Validations: skip removes selected types from an otherwise full report, while include restricts the report to selected types.
Use it to focus a test run on one area, such as color contrast or missing labels, without listing every other type to exclude.
Issue type IDs can be found by inspecting a JSON report as described in Web Reports.
Default: every validation type is reported.
The setting is global. Unlike Skip Validations it takes no URL pattern and no
CSS selector, and it applies to the whole scan. It is available only through the modern analysis
configuration schema shown below; there is no legacy flat spelling for it.
For every analysis in the run, add the setting to the service options in wdio.conf.js:
1services: [2 [3 Evinced.WdioService,4 {5 analysis: {6 INCLUDE_VALIDATIONS: ['NO_DESCRIPTIVE_TEXT', 'WRONG_SEMANTIC_ROLE']7 },8 },9 ],10],
It can also be set for a single session or a single analysis:
1// For one continuous-mode session.2await browser.evStart({3 analysis: { INCLUDE_VALIDATIONS: ['NO_DESCRIPTIVE_TEXT'] }4});56// OR7// for one analysis.8const issues = await browser.evAnalyze({9 analysis: { INCLUDE_VALIDATIONS: ['NO_DESCRIPTIVE_TEXT'] }10});
Reporting every validation type
Leaving the setting out reports every validation type. So does the wildcard *, on its own or as
a single-item list, and so does an empty list.
A wildcard listed next to concrete type names is not a wildcard. ['NOT_FOCUSABLE', '*'] reports
only NOT_FOCUSABLE; the * entry is treated as a type name that matches nothing. This mirrors
the behavior of Skip Validations.
Combining with Skip Validations
The two settings apply together, and a result is reported only if it passes both. Include narrows the set of types; skip can still suppress individual elements within the types that remain. A type named in both is reported only on the elements its skip rule does not match.
Type names are not validated
Type names are not checked against the engine's list of issue types, so a name that is not a real type ID matches nothing.
Note: an empty list and a list of names that match nothing produce opposite results. An empty
list reports every validation type. A list such as ['NOT_FOCUSABL'] reports no issues at all. If
a run returns zero issues unexpectedly, check the type names in the list against a JSON report.
Recording Service
This setting controls how frequently event-triggered functions are executed, helping to optimize performance and responsiveness. The option does not enable or disable the event-handling service itself but determines how frequently events are processed based on the selected mode.
Available modes:
debounce- Delays execution until a set time has passed since the last event. Useful for actions triggered by continuous input, such as typing in a search box, to avoid excessive function calls.throttle- Ensures execution at fixed intervals, regardless of event frequency. Ideal for scenarios like handling window resize events or scroll tracking, where limiting execution prevents performance degradation.
Default: Functions execute as triggering events occur.
An example of how to modify settings:
1await browser.evStart({2 recordingService: {3 ENABLE_DEBOUNCE_NEW_SELECTORS: true,4 DEBOUNCE_NEW_SELECTORS_MS: 500,5 DELAY_MODE: 'throttle'6 }7});89await browser.url("https://demo.evinced.com/");1011const issues = await browser.evStop();
Settled Analysis
This setting controls accessibility analysis after user interactions like clicks and actions. It ensures that accessibility issues in dynamic content that appears after user actions are properly captured and reported.
Why you need this configuration:
Settled analysis automatically captures accessibility issues that appear after user interactions such as clicks, form submissions, or other dynamic changes. When users interact with your application, new content may be revealed (dropdowns, modals, dynamically loaded sections) that contains accessibility violations. Without settled analysis, these issues would only be detected during the final evStop() call, potentially missing critical accessibility problems that occur during the user journey.
Key benefits:
- Complete coverage: Captures accessibility issues in dynamically revealed content
- Real-time detection: Issues are found immediately after user interactions
- Better debugging: Issues are associated with specific user actions that triggered them
- Comprehensive reporting: Provides a complete picture of accessibility state throughout the test
When to disable: You may want to disable settled analysis in performance-critical test scenarios where the additional analysis calls impact test execution time, or when testing static pages with no dynamic content.
Throttling mechanism:
The throttling feature prevents excessive analysis calls when users perform rapid interactions (like multiple quick clicks or form field changes). Without throttling, each user action could trigger a separate analysis, leading to:
- Performance degradation: Multiple concurrent analysis calls can slow down test execution
- Resource consumption: Excessive CPU and memory usage from frequent DOM analysis
Why you need throttling configuration:
- Optimize performance: Reduce the frequency of analysis calls during rapid user interactions
- Prevent resource exhaustion: Control CPU and memory usage in complex test scenarios
- Maintain test stability: Avoid conflicts between multiple simultaneous analysis operations
- Customize timing: Adjust delay based on your application's response characteristics
Default:
- Settled analysis: Enabled.
- Throttling: Disabled (immediate execution).
- Throttle delay: 200ms when enabled.
An example of how to modify settings:
1await browser.evStart({2 settledAnalysis: {3 disabled: false, // When true, completely disables settled analysis after user interactions4 throttleConfig: {5 delay: 500, // Minimum time (ms) between settled analysis executions6 disabled: false // When true, disables throttling for immediate execution7 }8 }9});1011await browser.url("https://demo.evinced.com/");12await browser.$("#button").click(); // Settled analysis will run after click (respecting throttle settings)1314const issues = await browser.evStop();
Shadow DOM Support
Shadow DOM is now supported by default. No additional configuration is needed.
If using an earlier release, configure shadow DOM support as follows:
1const issues = await browser.evAnalyze({ enableShadowDom: true });
IFrames Support
When true, accessibility analysis includes iframe that exist inside the page.
Default: true.
For disabling iFrames analysis on a global level edit the wdio.conf.js file: add the following parameter to properties on top level.
So it may look like:
1services: [2 [3 Evinced.WdioService,4 {5 includeIframes: false,6 },7 ],8],
It is also possible to disable iFrames analysis within one session or one analysis:
1// Disable the feature for one Continuos mode session.2await browser.evStart({3 includeIframes: false4});56// OR7// disable the feature for one analysis.8const issues = await browser.evAnalyze({9 includeIframes: false10});
Important! The current implementation does not support an analysis of Cross Origin iFrames. Only issues from the iFrames with the origin of the parent iFrame will be gathered.
Note: Since includeIframes is enabled by default, your tests may take longer to run when analyzing pages with multiple or complex iFrames.
Include Hidden IFrames Domain
Configures which hidden iframe domains are included in accessibility analysis. By default, hidden iframes are excluded for performance and security reasons.
This setting allows you to specify a list of domains to analyze even when the iframe is hidden.
1const issues = await browser.evAnalyze({2 includeIframes: true,3 includeHiddenIframeDomains: ["example.com", "test.com"]4});
Disable Puppeteer
The WebdriverIO JS SDK uses Puppeteer to enable advanced browser event tracking via the Chrome DevTools Protocol (CDP). When disabled, the SDK falls back to click-based mode and does not rely on CDP or browser events.
When to Disable:
Disable Puppeteer if you encounter runtime errors such as ENOTFOUND when establishing CDP connections. This commonly occurs in:
- Selenium Grid environments
- Kubernetes (K8s) deployments
- Other environments where CDP connections cannot be established
Configuration Option: usePuppeteer
1services: [2 [3 Evinced.WdioService,4 {5 usePuppeteer: false, // Set to false to disable Puppeteer6 },7 ],8],
true(Default): Puppeteer is enabled; browser events are captured via CDP.false: Puppeteer is disabled; SDK runs in click-based mode only.
Disabling Puppeteer also turns off CDP screenshot capture, since the SDK reaches CDP through the same connection. Screenshots still work — the analysis engine captures them in the page instead — but they are no longer full-page compositor captures. See the Reports Screenshots section above.
Network Idle Detection
The networkIdle configuration enables the SDK to wait for all network requests to complete before
running accessibility analysis. This is particularly useful for modern web applications that load
content dynamically after the initial page load.
Why use Network Idle Detection?
When testing modern web applications, accessibility analysis may run before all content has loaded, resulting in:
- Incomplete results: Dynamic content not yet rendered won't be analyzed
- False negatives: Accessibility issues in delayed content won't be detected
- Inconsistent results: Analysis timing may vary between test runs
Network idle detection solves this by ensuring all network activity has settled before analysis begins.
Configuration Options:
| Option | Type | Default | Description |
|---|---|---|---|
enabled | boolean | false | Enables or disables network idle detection |
idleTimeout | number | 300 | Time in milliseconds to wait after the last network request completes before considering the network idle |
maxWaitTime | number | 7500 | Maximum time in milliseconds to wait for network idle. If exceeded, analysis proceeds with a warning |
Network idle detection can be configured globally during SDK initialization or per-command for granular control.
Global Configuration
Edit the wdio.conf.js file and add networkIdle to the service properties:
1services: [2 [3 Evinced.WdioService,4 {5 networkIdle: {6 enabled: true,7 idleTimeout: 300,8 maxWaitTime: 75009 }10 },11 ],12],
Per-Command Configuration
Override global settings for specific commands:
1// Override for evStart2await browser.evStart({3 networkIdle: {4 enabled: true,5 maxWaitTime: 100006 }7});89// Override for evAnalyze10await browser.evAnalyze({11 networkIdle: {12 enabled: true,13 idleTimeout: 500,14 maxWaitTime: 500015 }16});
How It Works:
The SDK monitors all network requests and waits for the network to become idle before proceeding with analysis:
- Network is considered "idle" when no requests are active for at least
idleTimeoutmilliseconds - Analysis waits for idle state or
maxWaitTime, whichever comes first - Configuration from
evStart()automatically applies to subsequent page navigations andevStop()
Best Practices:
- Start with defaults: Enable with default settings and adjust only if needed
- Increase timeout for slow APIs: If your backend is slow, increase
maxWaitTime - Use per-command for specific pages: Enable only for pages with dynamic content
Important Notes:
- Disabled by default: The feature is opt-in to maintain backward compatibility
- No overhead when disabled: When not enabled, there is zero performance impact
- Automatic timeout extension: Command timeouts are automatically adjusted based on
maxWaitTime - Warning on timeout: If
maxWaitTimeis exceeded, the SDK logs a warning and proceeds with analysis
Global Switch
When false, disables Evinced functionality. Enabled by default, use this setting to disable
Evinced accessibility analysis when not needed during test development or when running CI jobs
where accessibility testing is not intended.
Default: true.
When switched off:
evStart()andevSaveFile()will be bypassed.evStop()andevAnalyze()will return an empty report.
Switching Evinced Functionality Off in Configuration
1exports.config = {2 services: [3 [Evinced.WdioService, {4 switchOn: false5 }]6 ]7};
Important! Global Switch environment variable overrides the global configuration option.
Switching Evinced Functionality Off in Environment
1export EV_SWITCH_ON=false
Baseline Comparison
Pilot Feature
Baseline comparison is currently in a pilot phase. The API is stable and ready to use; some details may be refined before general availability.
Baseline comparison lets you detect accessibility regressions between test runs. You save a scan result as a JSON baseline, then compare every subsequent run against that file. Each issue in the new scan is classified as:
new— appeared since the baseline was saved (a regression you need to address)persistent— present in both the baseline and the current scanresolved— present in the baseline but no longer detected (an improvement)
This approach lets CI gates act on changes rather than the raw issue count, so you can catch regressions without being blocked by pre-existing known issues.
Workflow Overview
Baseline comparison runs in two phases:
- Bootstrap — run your tests, save the scan results as a JSON baseline file.
- Compare — run the same tests again and call
evCompare()to classify every issue against the saved baseline.
Step 1 — Save a Baseline
To create your baseline:
- Run your test to collect the current accessibility issues.
- Save the results as a JSON file using
evSaveFile(). - Commit the file to a dedicated folder in your repository (for example
./baseline/) so that every CI run compares against the same fixed reference point.
1describe('save accessibility baseline', () => {2 it('captures the home page', async () => {3 await browser.url('https://your-app.com/');4 const issues = await browser.evAnalyze();56 // Save as JSON to a committed folder — this file is your baseline7 await browser.evSaveFile(issues, 'json', './baseline/home-page.json');8 });9});
Note: every JSON report written by
evSaveFile()automatically includes a nestedmetadataobject with the producing SDK's name and version — no extra setup required:1{2 "testId": "...",3 "metadata": {4 "sdkName": "@evinced/webdriverio-sdk",5 "sdkVersion": "2.59.0"6 },7 "issues": [ ... ]8}
evCompare()reads this envelope to detect when a baseline was produced by a different SDK or SDK version and surfaces a warning inresult.warnings(see Result Shape). Baseline files saved before this field existed are still accepted — no warning is raised in that case.
Step 2 — Compare Against the Baseline
Call evCompare() with a fresh scan result and the path to the saved baseline file. Each issue in the new scan is classified as new, persistent, or resolved.
Single-page scan (evAnalyze):
1describe('detect new accessibility regressions', () => {2 it('compares the home page against the baseline', async () => {3 await browser.url('https://your-app.com/');4 const issues = await browser.evAnalyze();56 const comparison = await browser.evCompare(issues, './baseline/home-page.json');78 // Fail the test only when new issues have been introduced9 expect(comparison.summary.newCount).toBe(0);10 });11});
Multi-page flow (evStart / evStop):
1describe('regression check across a user flow', () => {2 it('checks the checkout flow against the baseline', async () => {3 await browser.evStart();45 await browser.url('https://your-app.com/');6 await $('button=Add to cart').click();7 await $('a=Checkout').click();89 const issues = await browser.evStop();1011 const comparison = await browser.evCompare(issues, './baseline/checkout-flow.json', {12 failOnNew: true,13 });1415 // Skipped runs (SDK disabled) are not a pass — see CI Gate below16 if (!comparison.skipped) {17 expect(comparison.failed).toBe(false);18 }19 });20});
Issue Classification
Each issue in comparison.issues carries a baselineStatus field:
| Status | Meaning |
|---|---|
new | Found in the current scan, not in the baseline — a regression |
persistent | Present in both the baseline and the current scan |
resolved | Present in the baseline, no longer detected — an improvement |
Resolved issues are returned separately in comparison.resolvedIssues[] and are only populated when includeResolved: true is set.
CI Gate with failOnNew
Use failOnNew: true to record a failure in the result when new issues are found. Gate your CI pipeline on the result, checking result.skipped first so that a disabled SDK is never mistaken for a clean pass.
1describe('accessibility regression gate', () => {2 it('fails the build only on new issues', async () => {3 await browser.url('https://your-app.com/');4 const issues = await browser.evAnalyze();56 const comparison = await browser.evCompare(issues, './baseline/home-page.json', {7 failOnNew: true,8 });910 if (comparison.skipped) {11 // SDK kill-switch is off — comparison did not run, so this is not a pass12 console.warn('Evinced SDK disabled — baseline comparison skipped');13 } else {14 // result.failed is true when failOnNew is set and new issues were detected15 expect(comparison.failed).toBe(false);16 }17 });18});
Result Shape
evCompare() returns a BaselineCompareResult object. It never throws for baseline-specific errors — any problem reading or parsing the baseline file is reported in result.errors[].
1{2 // All new and persistent issues, each with a baselineStatus field3 issues: Array<Issue & { baselineStatus: 'new' | 'persistent' }>,45 // Resolved issues — only populated when includeResolved: true6 resolvedIssues?: Array<Issue & { baselineStatus: 'resolved' }>,78 summary: {9 newCount: number,10 persistentCount: number,11 resolvedCount: number,12 totalInBaseline: number,13 totalInNew: number,14 // SDK name/version that produced the baseline file (from its `metadata` envelope).15 // Empty strings when the baseline predates metadata support.16 baselineProducer: { sdkName: string, sdkVersion: string },17 },1819 // true when failOnNew is not set, or no new issues were detected20 passed: boolean,21 // true when failOnNew: true and at least one new issue was detected, or on a read/parse error22 failed: boolean,23 // Human-readable explanation when failed is true24 failureReason?: string,2526 // true when no comparison ran because the SDK kill-switch is off.27 // passed and failed are then both false, so a CI gate must check skipped first.28 skipped?: boolean,2930 // Advisory messages — for example when the baseline's metadata (see Step 1)31 // shows it was produced by a different SDK or SDK version than the current scan,32 // or when the SDK is disabled33 warnings: string[],3435 // Populated when comparison cannot proceed (file missing, invalid JSON, etc.)36 // When present and non-empty, failed is true and all summary counts are 037 errors?: Array<{ code: string, message: string }>,38}
Error handling example:
1const comparison = await browser.evCompare(issues, './baseline/home-page.json');23if (comparison.errors?.length) {4 console.error('Baseline comparison failed:', comparison.errors);5 // Consider bootstrapping a new baseline here6}78expect(comparison.summary.newCount).toBe(0);
Options
| Option | Type | Default | Description |
|---|---|---|---|
failOnNew | boolean | false | Set result.failed to true if any new issues are found |
includeResolved | boolean | false | Populate result.resolvedIssues[] with issues that are no longer detected |
Configuration File
Default options can be set globally in your wdio.conf.js services options, or in an evConfig.yaml (or evConfig.json) file, under the baseline key.
wdio.conf.js:
1exports.config = {2 services: [3 [4 Evinced.WdioService,5 {6 baseline: {7 failOnNew: true,8 includeResolved: false,9 },10 },11 ],12 ],13};
evConfig.yaml:
1baseline:2 failOnNew: true3 includeResolved: false
evConfig.json:
1{2 "baseline": {3 "failOnNew": true,4 "includeResolved": false5 }6}
Per-call options passed directly to evCompare() always take precedence over the configuration file or wdio.conf.js services options.
Uploading Reports to Evinced Platform
Introduction
Evinced Platform allows you to seamlessly collect, organize, visualize and monitor Evinced accessibility reports in one place. In this section, we will guide you through the key functionalities of the upload methods of the accessibility reports from the Evinced SDK to the Evinced Platform, which was introduced in version to be determined. This upload method is fully compatible with the previous versions of the Evinced SDK API, and is disabled by default.
Enable Upload Report to Platform
To enable the uploading functionality of accessibility reports to the Evinced Platform
you will need to set the enableUploadToPlatform feature flag to true via
the global setUploadToPlatformConfig method:
1import EvincedService from '@evinced/webdriverio-sdk';2const Evinced = EvincedService.default;3Evinced.setUploadToPlatformConfig({enableUploadToPlatform: true})
You can also use the external config wdio.conf.js and add the values to be loaded.
Important! The external config has more precedence if both initialization options are used.
1 uploadToPlatformOptions: {2 enableUploadToPlatform: true,3 setUploadToPlatformDefault: false4 }
Note: Using uploadToPlatform: true in method parameters (e.g., browser.evAnalyze({ uploadToPlatform: true })) is not sufficient on its own. You must first enable the feature by setting enableUploadToPlatform: true via setUploadToPlatformConfig() or wdio.conf.js. The method parameter only controls whether a specific report uploads when the feature is already enabled.
Automatic Report Upload
Once the enableUploadToPlatform method is set to true and setUploadToPlatformDefault is true (which is the default),
all generated reports will be automatically uploaded to the Platform immediately upon calling the evStop() or evAnalyze() command.
How it works:
- When
enableUploadToPlatform: trueandsetUploadToPlatformDefault: true (default), upload happens automatically - No additional code is needed - just call
evAnalyze()orevStop()and the report uploads - Upload occurs synchronously as part of the command execution
If you want to change this behavior and control uploads manually, set the setUploadToPlatformDefault feature flag to false.
1import EvincedService from '@evinced/webdriverio-sdk';2const Evinced = EvincedService.default;3Evinced.setUploadToPlatformConfig({enableUploadToPlatform: true, setUploadToPlatformDefault: true})
If the setUploadToPlatformDefault is disabled, you can still upload
selected reports to the platform.
For that, use the following parameter in the evStop() command:
1 await browser.evStop({uploadToPlatform: true});
Or, in the evAnalyze() command:
1 await browser.evAnalyze({uploadToPlatform: true});
Test Names
To facilitate report management and be able to distinguish between different reports on the Platform, use the setTestInfo method to inform the test name and test class.
It’s recommended to do that in the “beforeEach” hook.
1describe('Upload to platform', () => {2 beforeEach(async () => {3 await browser.addLabel({ testName: 'your test name' });4 });5});
Labels and Custom Fields
You can attach labels and custom fields to your report to enhance readability and organization in the platform. Labels help you filter, search, and organize reports on the Evinced Platform.
There are two types of labels:
Built-in Labels: Pre-defined labels that can be set using the addLabel method. Available built-in labels include:
testName- The name of the testtestFile- The file path of the testenvironment- The environment where the test runs (e.g., "Development", "Staging", "Production")flow- The test flow identifiergitBranch- The Git branch namegitUserName- The Git user namegitVersion- The Git commit version
Custom Labels: Flexible key-value pairs that can be set using the customLabel method. You can use any custom key-value pairs, including:
- Single values:
{ productVersion: '1.0.0' } - Multiple values (arrays):
{ browsers: ['Chrome', 'Firefox'] } - Special label
unitId: Use this to tag tests for relevant units within your organization
See the following code examples of how to set up labels:
1describe('Upload to platform', () => {2 beforeEach(async () => {3 // Set built-in labels4 browser.addLabel({5 testName: 'My Test',6 environment: 'Development',7 gitBranch: 'main'8 });910 // Set custom labels (including unitId for organizational tagging)11 browser.customLabel({12 customParameter: "demo value",13 productVersion: "1.00",14 browsers: ["Chrome 1.00", "Firefox 2.00"],15 SDK: "Wdio SDK",16 unitId: 'unit-123' // Tag for organizational unit17 });18 });19});
Use of beforeEach and afterEach Hooks
We recommend using the beforeEach and afterEach hooks to control analysis sessions and upload reports to the platform. This way, each test will be uploaded separately with its own report.
In beforeEach hook use evStart() to start Evinced analysis and set any labels
you want for the report to contain when uploading to the platform.
In the afterEach hook call evStop() to stop analysis and upload reports to the platform.
See this code example:
1describe('Upload hooks example ', () => {2 beforeEach(async () => {3 await browser.url('https://demo.evinced.com/');4 browser.addLabel({5 testName: 'testHooks',6 testFile: 'upload-hooks.js',7 environment: 'Development'8 });9 await browser.evStart();10 });1112 afterEach(async () => {13 await browser.evStop({ uploadToPlatform: true });14 });15});
Putting All of This Together
Here is a complete code snippet of how to perform uploads to the platform on a per-test basis.
1describe('Upload hooks example ', () => {2 beforeEach(async () => {3 browser.addLabel({ testName: 'customTestName' });4 browser.customLabel({5 customParameter: "demo value",6 productVersion: "1.00",7 SDK: "Wdio SDK",8 });9 await browser.evStart();10 });1112 afterEach(async () => {13 await browser.evStop({ uploadToPlatform: true });14 });15 it("Check upload to platform using evStop", async () => {16 await browser.url('https://demo.evinced.com/');17 });18});
Tutorials
You can find fully functional example projects on our GitHub.
Generating a comprehensive accessibility report for your application
In this tutorial, we will enhance our existing WebdriverIO UI test with the Evinced WebdriverIO SDK in order to check our application for accessibility issues. In order to get started you will need the following:
- All of the prerequisites for the Evinced WebdriverIO SDK should be met
- Evinced WebdriverIO SDK should be added to your project
Preface - existing UI test overview
Let’s consider the following basic UI test as our starting point.
1describe("Evinced Demo Site tests", () => {2 test("Search Test", async () => {3 await browser.url("https://demo.evinced.com/");4 const BASE_FORM_SELECTOR =5 "#gatsby-focus-wrapper > main > div.wrapper-banner > div.filter-container";6 const SELECT_HOME_DROPDOWN = `${BASE_FORM_SELECTOR} > div:nth-child(1) > div > div.dropdown.line`;7 const SELECT_WHERE_DROPDOWN = `${BASE_FORM_SELECTOR} > div:nth-child(2) > div > div.dropdown.line`;8 const TINY_HOME_OPTION = `${BASE_FORM_SELECTOR} > div:nth-child(1) > div > ul > li:nth-child(2)`;9 const EAST_COST_OPTION = `${BASE_FORM_SELECTOR} > div:nth-child(2) > div > ul > li:nth-child(3)`;10 const SUBMIT_BUTTON = `${BASE_FORM_SELECTOR} > .search-btn`;11 await $(SELECT_HOME_DROPDOWN).click();12 await $(TINY_HOME_OPTION).click();13 await $(SELECT_WHERE_DROPDOWN).click();14 await $(EAST_COST_OPTION).click();15 await $(SUBMIT_BUTTON).click();16 expect(browser).toHaveUrlContaining("/results");17 });18});
We wrote this test for a demo travel site called TRVL that has a few known accessibility issues.
The purpose of this test is to check the functionality of the main application screen and ensure a user can successfully select their desired trip. For now, this test is only concerned with the functional testing of the app. However, with the help of the Evinced WebdriverIO SDK, we can also check it for accessibility issues along the way. Let’s go through this process with the following step-by-step instructions.
Step #1 - Verify the Evinced WebdriverIO service
Remove optional configuration in wdio.conf.js from Evinced.WdioService service.
Step #2 - Start the Evinced engine
Now that we have everything we need to scan for accessibility issues, let’s start the Evinced engine. Since we are going to use it scan throughout our test, the best place for its initialization will be after we navigate to the desired website.
1describe("Evinced Demo Site tests", () => {2 test("Search Test", async () => {3 await browser.url("https://demo.evinced.com/");4 // Add command to start recording issues5 await browser.evStart();6 const BASE_FORM_SELECTOR =7 "#gatsby-focus-wrapper > main > div.wrapper-banner > div.filter-container";8 const SELECT_HOME_DROPDOWN = `${BASE_FORM_SELECTOR} > div:nth-child(1) > div > div.dropdown.line`;9 const SELECT_WHERE_DROPDOWN = `${BASE_FORM_SELECTOR} > div:nth-child(2) > div > div.dropdown.line`;10 const TINY_HOME_OPTION = `${BASE_FORM_SELECTOR} > div:nth-child(1) > div > ul > li:nth-child(2)`;11 const EAST_COST_OPTION = `${BASE_FORM_SELECTOR} > div:nth-child(2) > div > ul > li:nth-child(3)`;12 const SUBMIT_BUTTON = `${BASE_FORM_SELECTOR} > .search-btn`;13 await $(SELECT_HOME_DROPDOWN).click();14 await $(TINY_HOME_OPTION).click();15 await $(SELECT_WHERE_DROPDOWN).click();16 await $(EAST_COST_OPTION).click();17 await $(SUBMIT_BUTTON).click();18 expect(browser).toHaveUrlContaining("/results");19 });20});
Step #3 - Stop the Evinced engine and create reports
As our test was executed we collected a lot of accessibility information. We can now perform accessibility assertions at the end of our test suite. Referring back again to our UI test the best place for this assertion will be the end of test actions. To stop the Evinced engine and generate the actual object representation of your accessibility report simply call the evStop() method. We can then output the report files in JSON format.
1describe("Evinced Demo Site tests", () => {2 test("Search Test", async () => {3 await browser.url("https://demo.evinced.com/");4 // Add command to start recording issues5 await browser.evStart();6 const BASE_FORM_SELECTOR =7 "#gatsby-focus-wrapper > main > div.wrapper-banner > div.filter-container";8 const SELECT_HOME_DROPDOWN = `${BASE_FORM_SELECTOR} > div:nth-child(1) > div > div.dropdown.line`;9 const SELECT_WHERE_DROPDOWN = `${BASE_FORM_SELECTOR} > div:nth-child(2) > div > div.dropdown.line`;10 const TINY_HOME_OPTION = `${BASE_FORM_SELECTOR} > div:nth-child(1) > div > ul > li:nth-child(2)`;11 const EAST_COST_OPTION = `${BASE_FORM_SELECTOR} > div:nth-child(2) > div > ul > li:nth-child(3)`;12 const SUBMIT_BUTTON = `${BASE_FORM_SELECTOR} > .search-btn`;13 await $(SELECT_HOME_DROPDOWN).click();14 await $(TINY_HOME_OPTION).click();15 await $(SELECT_WHERE_DROPDOWN).click();16 await $(EAST_COST_OPTION).click();17 await $(SUBMIT_BUTTON).click();18 expect(browser).toHaveUrlContaining("/results");19 // Add a command to stop recording and retrieve issues list20 const issues = await browser.evStop();21 // Save issues to a report file22 await browser.evSaveFile(issues, "json", "./test/issues.json");23 await browser.evSaveFile(issues, "sarif", "./test/issues.sarif.json");24 await browser.evSaveFile(issues, "html", "./test/issues.html");25 await browser.evSaveFile(issues, "csv", "./test/issues.csv");26 // Assert issues count27 expect(issues).toHaveLength(0);28 });29});
Fail the test if critical issues are found
Here you can see a way of failing your test if critical accessibility issues are found using WebdriverIO JS SDK.
Using evAnalyze:
1const issues = await browser.evAnalyze();23const criticalIssues = issues.filter((issue) => issue.severity.name === 'Critical');4await assert(criticalIssues.length === 0, 'found critical issues');
Using evStart/evStop:
1await browser.evStart();2const issues = await browser.evStop();34const criticalIssues = issues.filter((issue) => issue.severity.name === 'Critical');5await assert(criticalIssues.length === 0, 'found critical issues');
The criticalIssues array will contain all the critical issues found during the scan. If the array is not empty, the test will fail on the assertion.
Support
Please feel free to reach out to support@evinced.com with any questions.
FAQ
- Can I configure which validations to run?
Yes, see the Configuration section for details on how to configure Axe validations to your needs.
- Can I run tests with Evinced using cloud-based services like Sauce Labs, Perfecto, or BrowserStack?
Yes, we have tested the Evinced SDK on many of these types of cloud-based services and expect no issues.